Algebra 2 (A2)

Challenging Gradient
Draw your own version of this photograph.
Challenging Gradient (A2) guides students to approach line graphs as telling specific stories. Interpreting graphs about recent social media trends, students implicitly analyse the gradients of these lines and develop their own graphical representation of stories about the school drinks machine, a train trip across England, and a young boy’s growth chart.
Students share ideas on how they find the height of a stack of cups. The relationship between the number of cups in a stack and the stack’s height is expressed in a function machine. By tracing a picture of several stacks of cups, a straight-line graph emerges. Other stacking contexts—plant pots, chairs, tables—allow students to draw comparisons between the rate at which the different stacks grow. The final section includes other contexts — filling a water tank, the ticking up of a taxi fares, the burning down of a candle — where students explore relations between two variables. Returning to their story work from the first section of the module, students are introduced to the formal language of gradients and intercepts inside linear equation notation.
Teaching materials for Challenging Gradient (A2)
Click on the tiles below to download materials for this module.


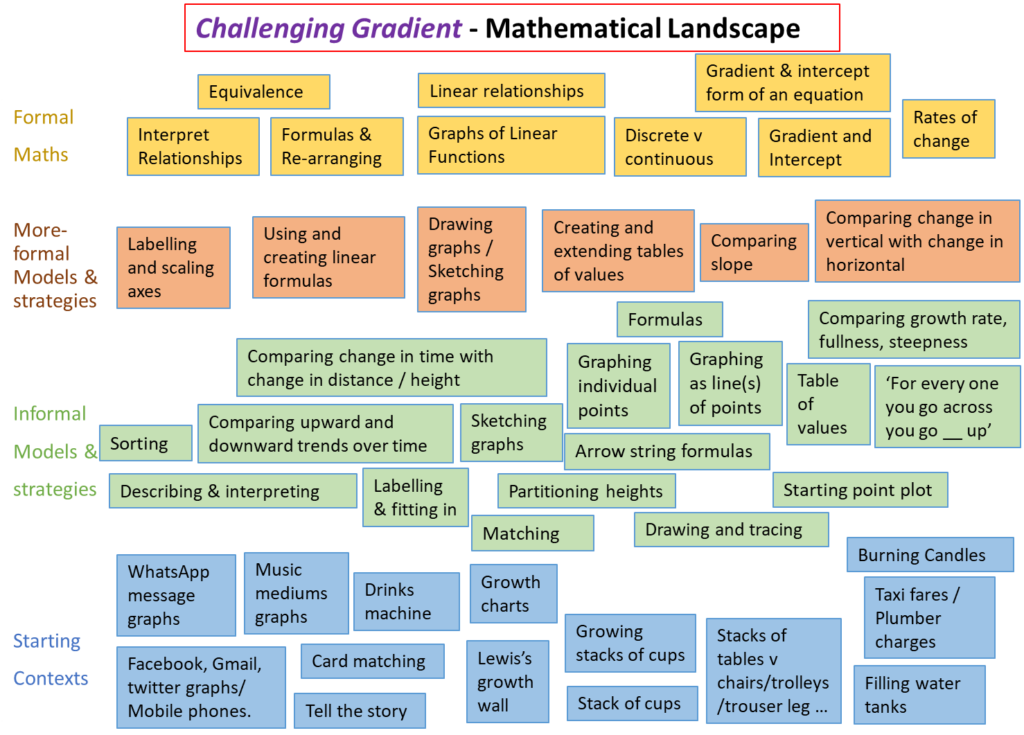
Overview of Challenging Gradient
Section A: Story Graphs
Lessons 1: Every Picture Tells a Story
Students consider and categorise a range of graphs that have been used in everyday life. They make sense of graphs of real-life situations and retrieve information from a range of different graphs.
Lesson 2: What’s the Story?
Students draw graphs from statements about real-life situations. They consider key features of graphs and make decisions on the axes and the units for a graph. They start to make sense of the gradient of a graph and compare different slopes. Students create stories that match a given shape of a graph.
Lesson 3 & 4: Distance-Time Graphs and Growth Charts
Students continue to make sense of real-life situations and draw graphs that represent a story. They apply these skills to distance-time graphs and growth charts. Students meet or revisit other topics within the maths curriculum such as averages, percentiles and conversion between units.
 Section B: Stacking Graphs
Lesson 5: Stacking Cups
Students express the height of a stack of cups using a variety of numerical expressions to reflect a variety of ways of partitioning the height, so encountering the order of operations and equivalence. By changing the amount of cups in the stack, students find ways to operate on the number of cups in order to work out the height of the stack. This relationship is expressed using an arrow string (number machine) model of the formula.
Lesson 6: Picturing Stacks of Cups
Rather than a single stack of cups, students now focus on a picture of three equally spaced stacks of 1, 2 and 3 cups. Initially they model the picture with their own freehand drawing, then trace particular features to reveal a graph! Students work back and forth between the stacking cups context and the line of dots on the graph. They develop meaning for the lip height of the cups as the distance to go up on the graph for every one that you go across. They also consider how the height of a dot placed at zero cups relates to the height of the cup hold.
Lesson 7: Other Stacking Situations
By comparing a stack of chairs and a stack of tables, students notice that the two stacks increase in height by different amounts. They use this rate of change to match each stack to the corresponding line of dots on a graph, indirectly focusing on the relative steepness of the two lines. Students start to consider other contexts where the quantity increases by a constant amount every time an item is added.
Section C: Linear Graphs
Lesson 8: Filling Water Tanks
The context of filling water tanks allows students to review and extend topics from the previous section, with the focus on the rate of change (slope) as well as the fixed amount (y-intercept). The concept of straight-line graphs and related subjects – gradient, x-intercept, y-intercept, intersection point of two graphs and parallel lines – are investigated but not all are formalised.
Lesson 9: Formulae
The context of candles is used to investigate decrease. Students begin to recognise that extending the line to the y-intercept does NOT give a real data point at x = 0, unless it is checked using the rule. Students recognise a linear relationship by looking at the formula, the table and the graph and seeing the relationship between the different representations.
Lesson 10: Abstract Linear Graphs
The concept of straight-line graphs and related subjects – gradient, x-intercept, y-intercept, intersection point of two graphs, parallel lines – are investigated and formalised.
More about RME landscapes.
Back to Our Materials.