Number 2 (N2)
Seeing It Differently
How many dots do you see? Count them again in a different way.
Interpreting early counting systems and puzzling over optical illusions set students off on an advanced examination of counting in Seeing It Differently (N2). This module celebrates difference by challenging students to see, count and systematically record dot patterns in multiple ways. In doing so, they generate numerical expressions that look different but must be worth the same. Following on work in Knowing the Unknown (A1), this module aims to strengthen students’ understanding of equivalent expressions, while also connecting these expressions to a geometrical arrangement. Its focus on the structure of various dot patterns also supports students in generalising their counting systems toward thinking about the nth term of a sequence.
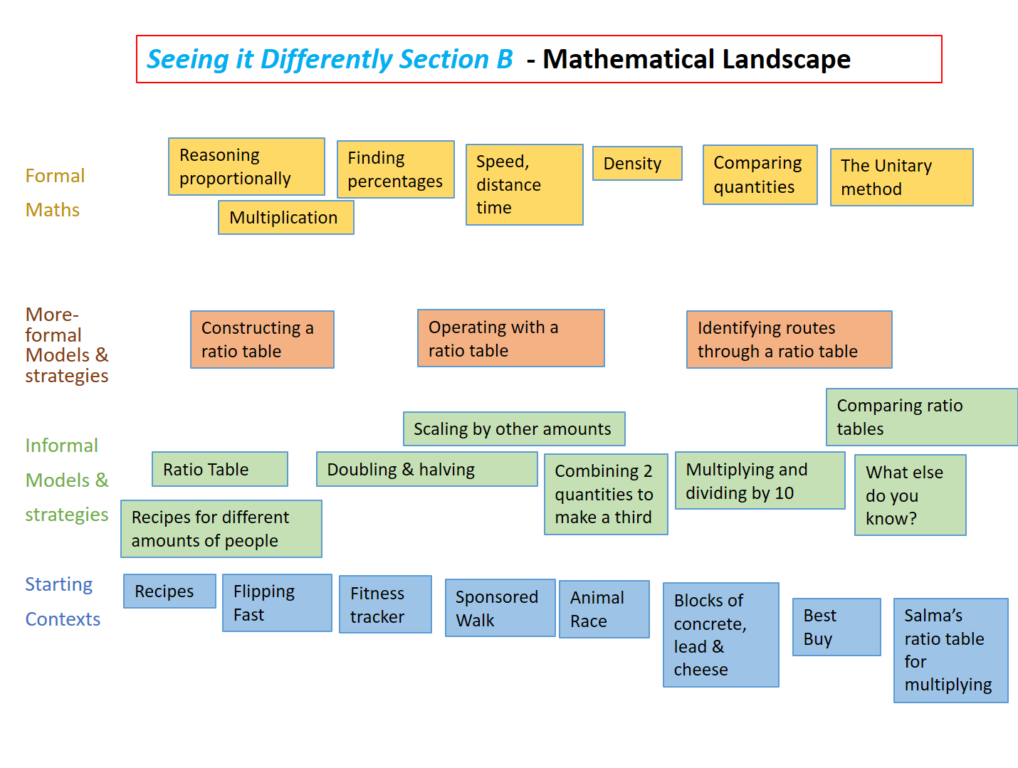
In the second part of the module, students are introduced to the ratio table through the context of recipes. The ratio table — a bar model without scale — is an extremely powerful tool that is extensively applicable across many topics in Number and Proportional Reasoning. In Seeing It Differently (N2), students practice using the ratio table to reason about density, compare best buys and as a more intuitive method for long multiplication and long division.
Teaching materials for Seeing It Differently (N2)
Click on the tiles below to download materials for this module.


Overview of Seeing it Differently
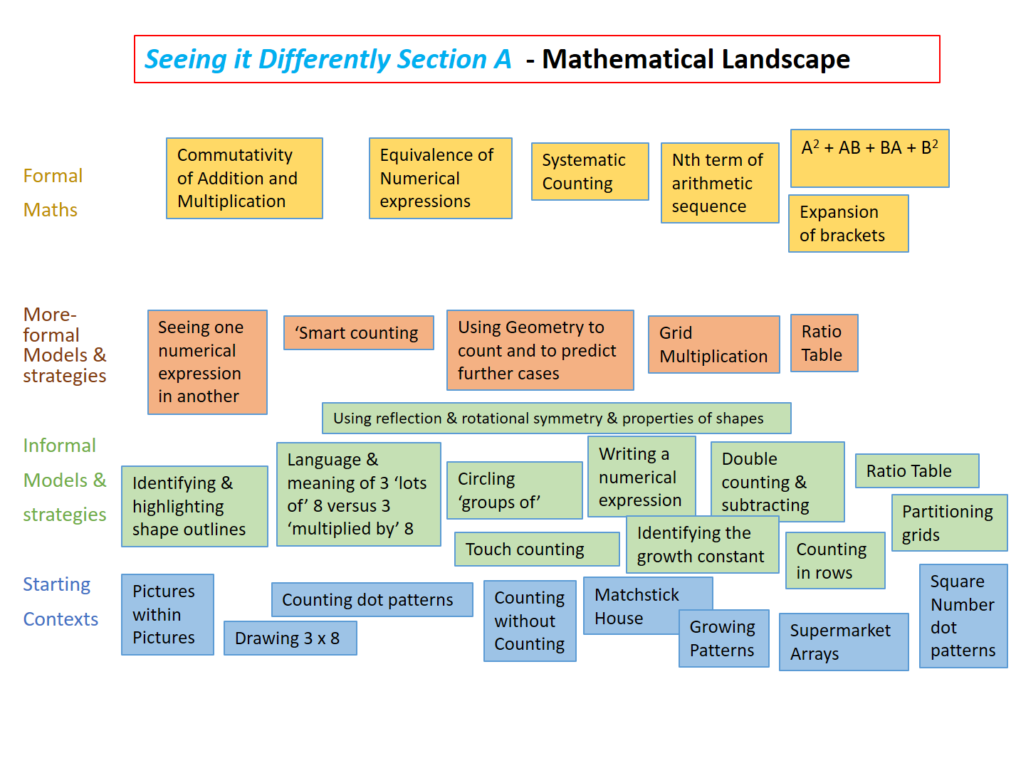
Section A: Visualising Multiplication
Lesson 1: Say What You See/How Many Do You See?
Students begin to recognise that there is often more than one way of seeing a picture/situation. They start to see squares within squares on a chessboard and wrestle with a famous optical illusion. Students consider various ways of representing an amount (86) using Roman numerals, Egyptian symbols, dots and deduce the meaning behind some of these older number systems.
Lesson 2: Ways to Count
Students count dot pattern arrangements. In doing so, they naturally group same pattern dots together and use repeated addition/multiplication to find the total number of dots. By using a variety of counting systems for the same pattern of dots students begin to see the subtle meaning behind, say, 5 x 6 as “5 groups of 6” or as “a group of 5 dots, multiplied by 6.” Using the symmetry of the dot arrangements to find other counting systems, they link the arrangement of dots on the picture with a numerical expression.
Lesson 3: Counting Without Counting
Students use other peoples’ numerical expressions, to predict possible counting systems for an arrangement of dots. They generalise counting systems by focusing on how a counting system links to the grouping of the dots in one particular case. They extend this counting system (and corresponding numerical expression) to a further diagram.
Lesson 4: Match Stick Houses
Patterns made from matchsticks form a ‘growing’ sequence. Students focus on how the pattern grows, referring to how sticks are placed and where to add the sticks in order to grow the pattern. By writing about what they notice and annotating diagrams, students use a range of strategies to predict the number of sticks required for various iterations of the pattern. Using picture- based systems of counting helps learners unravel the common misconceptions. I.e. it is possible to use stick pictures to explain why the 6th diagram does not require twice as many sticks as the 3rd diagram.
Lesson 5: Another Point of View
Students consider a variety of real world arrays and stacks. They count the amount of items in a variety of ways identifying groups on the picture, partitioning the array, using vertical multiplication algorithms, and writing a numerical expression. By matching each strategy to the picture, students continue to strengthen their understanding of the links between arrays and multiplication.
Section B: Introducing the Ratio Table
Lesson 6: Junior MasterChef
Students meet the ratio table through the context of recipes and finding the amounts of ingredients required for different amounts of servings. Student use the ratio table as a structure to create equivalent ratios by halving, doubling, multiplying, dividing and combining quantities by adding and subtracting.
Lesson 7: Flipping Fast
Students extend the use of a ratio table to represent and solve problems involving rates, including speed/distance/time problems. Rather than substitute numbers into the speed, distance, time formula, students use logical reasoning through the ratio table to find equivalent distances and times for people moving at a constant speed: The ratio table provides a tool to interpret the question as well as a means to answer it.
Lesson 8: Blocks of Concrete
Students make comparisons between two identically sized concrete blocks as a way of linking the mass of a block with the substance from which it is made. They work on the language associated with the notation ‘11g/cm3’ and draw a picture to match. They represent the density of lead (11g/cm3 ) in a ratio table and find the volume of other lead objects. By drawing two ratio tables students decide on the ‘best buy’. Students learn how to use the ratio table for long multiplication and long division calculations.
More about RME landscapes.
Back to Our Materials.