Proportional Reasoning 2 (PR2)
For Every One
Imagine you had a box of these black, red and brown beads. Describe to someone how to make a copy of this necklace.
For Every One (PR2) is packed with contexts which prompt students to develop meaning for ratio, proportion and scale. Colourful necklaces are an evocative context through which students naturally develop their own shorthand (“For every…”) and sense of a repeating pattern. Contexts—like vinaigrette dressing presented in a cylinder and mixing squash in a glass—are chosen for their ‘bar-like’ imagery, helping to focus questions on proportional comparisons. The ratio table takes centre stage in this module as a flexible way to scale up recipes, convert between currencies and measurements, or share pizza in a given ratio.
In the module’s second section, students use the ratio table to make sense of measurement conversions and to reason about the efficiency of different car engines. The final section of For Every One (PR2) asks students to use a range of ‘fitting in’ strategies to examine the Vitruvian Man type relationships—measuring, for example, the ratio of their head length to their height. They also explore the aspect ratio of different smart phones and use formal ratio notation to make sense of scaling images and distortion.
Teaching materials for For Every One (PR2)
Click on the tiles below to download materials for this module.


Overview of For Every One
Section A: Comparing and Contrasting
Lessons 1: What’s in a Necklace?
Students study beaded necklaces identifying repeating patterns. They start to recognise that the repeating pattern can be seen in a variety of positions within the necklace. By considering how many of a particular colour of bead occurs within the whole necklace, students develop a sense of how many groups of the repeating string there are. Through this necklace context, they develop meaning for the language associated with ratio i.e. ‘for every …. there are ….’ And for the notation _ : _
Lesson 2: Expanding the Business
Students develop a range of strategies for scaling from one ‘unit’ of the repeating string of beads to a necklace that contains around 150 beads. Strategies include repeated addition, repeated subtraction, multiplication and a ratio table version.
Lesson 3: Unthreaded Necklaces
Students work from the context of unthreaded necklaces where they need to group the coloured beads in order to find a ‘base ratio’ of the repeating pattern. Strategies vary from a ‘one for you, one for you…,’ sharing model of dividing the beads… to seeing how many groups would work for both colours of bead. This section is working on the meaning behind the formal procedure for simplifying a ratio.
Lesson 4: The Real Cost of Shopping
Students share informal ideas about how to compare the price of an item in the UK, Europe, and America. The model of the ratio table is used to convert pounds to Euros and pounds to dollars. Students use the ratio table to work out the mark up on price tickets from the UK to Europe. They work out how much cheaper some electrical goods are in America compared with the UK.
Lesson 5: What’s in a Salad?
Students become familiar with the context of a vinaigrette salad dressing through a YouTube clip of Gordon Ramsey and a BBC Good Food Guide recipe. The vinaigrette dressing is deliberately chosen because the 2 parts (oil and vinegar) separate out and when viewed in a glass cylinder provide another real life ‘bar model’. Students start to make comparisons between the relative ‘vinegariness’ of 3 different recipes using a variety of strategies. In doing so they expose their current stances on proportional reasoning. (See ‘About the Maths’ sections for more detail). Students use a ratio table to find several ‘same tasting’ / equivalent recipes.
 Lesson 6: Dressing Salads
Students work from a photographic representation of vinaigrette dressing, aiming to describe a recipe in words, using both part-to-part descriptors and the ratio table. They use ratio tables to compare recipes for porridge and for sponge cakes.
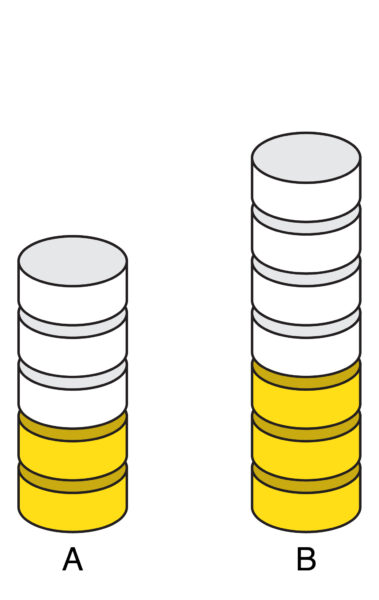
Lesson 7: Which Drink Tastes Stronger?
The theme of comparing the strength of two recipes continues. Here, students have to draw an accurate representation of the amount of squash and water they would use to make a drink. Then, they compare this with a ‘1 part squash to 4 parts water’ version. Orange squash drinks are modelled using towers of coloured discs. Students make strength comparisons between two ‘drinks’ using two strategies of their own choice. Various approaches to the same problem are modelled and the students are asked to make sense of these.
Lesson 8: Sharing Pizza
The context of chopping up rectangular pizzas so that one person has say 5 parts while the other person has 4 parts, then sharing the price of the pizza according to what each person has eaten leads students to informally develop strategies for ‘sharing a quantity in a given ratio’.
Section B: It’s Times for Ratio Tables
Lesson 9: Measuring
Students are introduced to conversions between cm and inches through the context of the (bar like) tape measure. After a reminder of the benefits and use of the bar, students are faced with problems where the bar is difficult to use and are then offered the ratio table as a more flexible model.
Lesson 10: Counting Cars
The context of pollution from cars is gradually introduced. Ratio tables are used to calculate the average number of people per car, and the possible number of cars and people given the average. Average (mean) is understood as the number of people “per one” (or “for every one”).
Lesson 11: Pollution
The context of car travel and car pollution is further developed. Students use ratio tables to make conversions between imperial units and metric units of speed (mph and km/h) and to determine and compare the unit rates of miles per gallon.
Section C: Same, Different, Similar?
Lessons 12 & 13: Old Versus New
Students begin to develop strategies to compare ratios. They will be familiar with these from the ‘Fitting It In’ module. Their informal strategies gradually develop into the use of the ratio table. They are able to compare ratios and consider the similarity of screen sizes.
Lessons 14 & 15: Vitruvian Man
The context allows students to develop a sense of proportionality and consider its links to ratio. The use of the ratio table is re-introduced.
Lessons 16 & 17: Distortion Or Not?
The context of models and scale drawings are introduced as further examples of questions that can be answered using a ratio table. The mathematics is challenging but the contexts provide links to real situations, in order to encourage understanding.

More about RME landscapes.
Back to Our Materials.